See channel connections, chats and apps
The Dashboard provides a clear overview of the solutions that are installed in your workspace. For Conclude Apps, see all your installed apps, and manage open or assigned tickets from the sidebar.
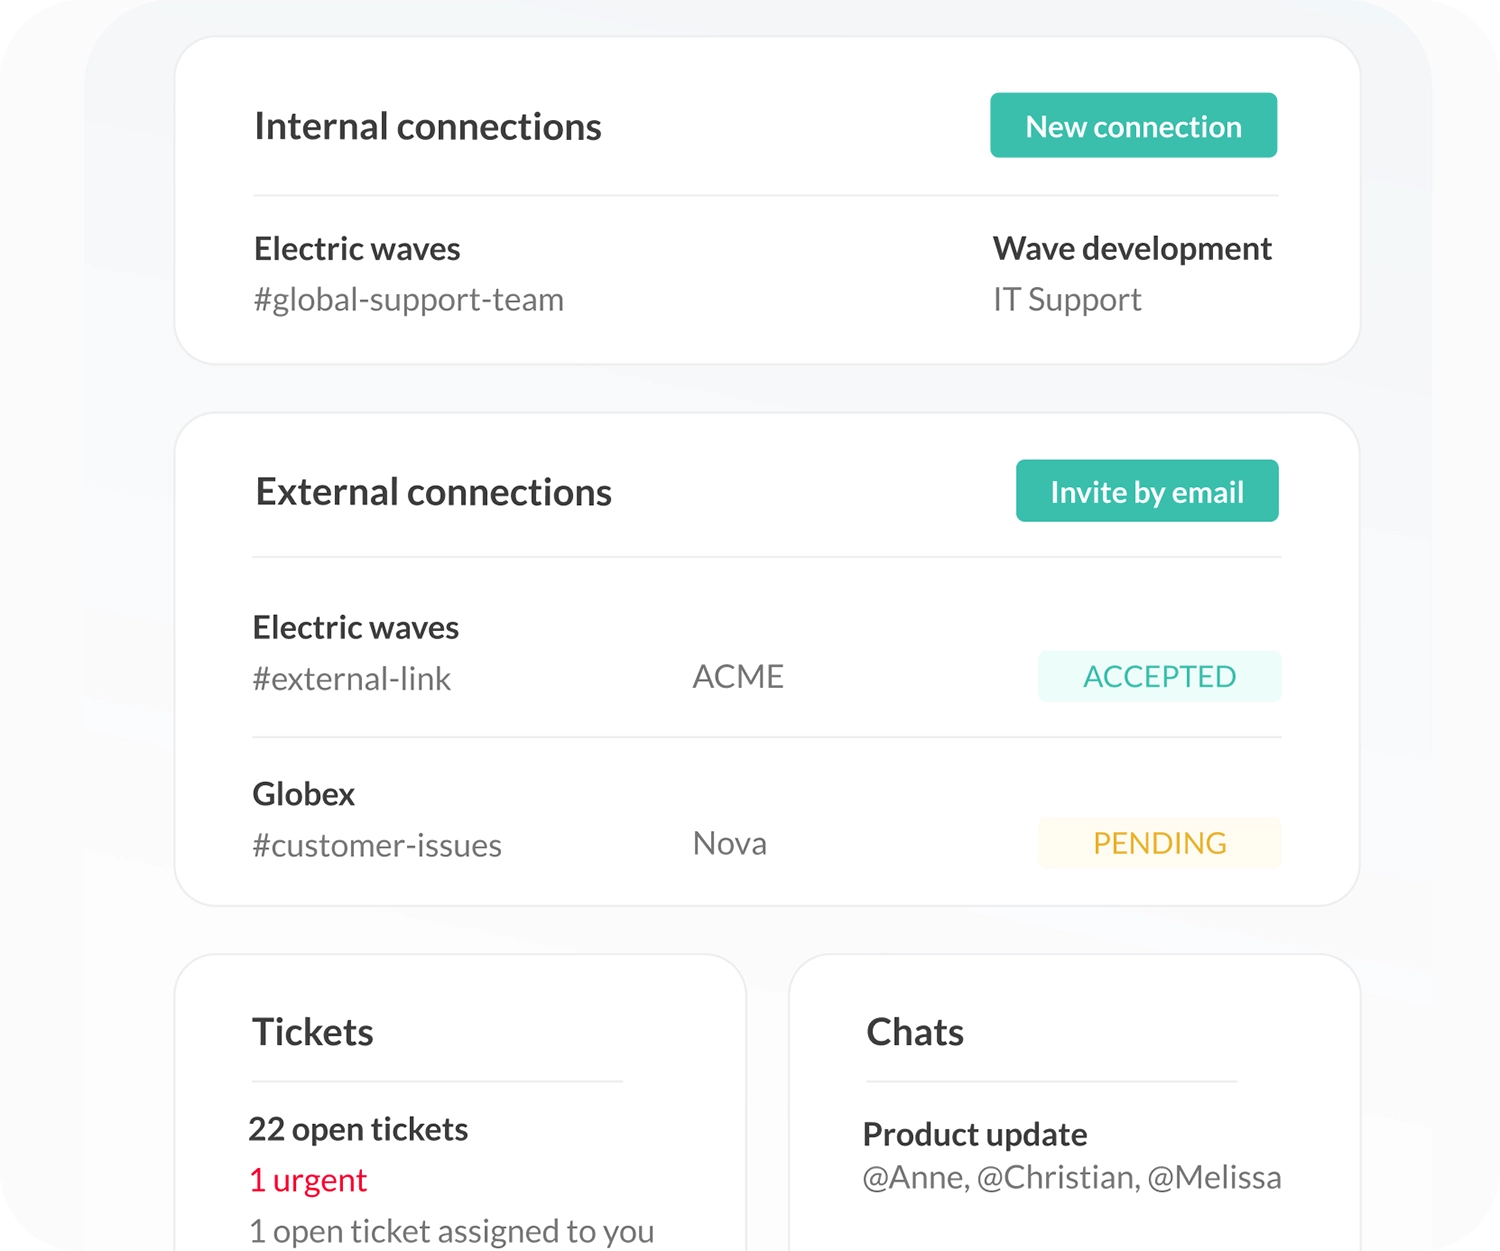
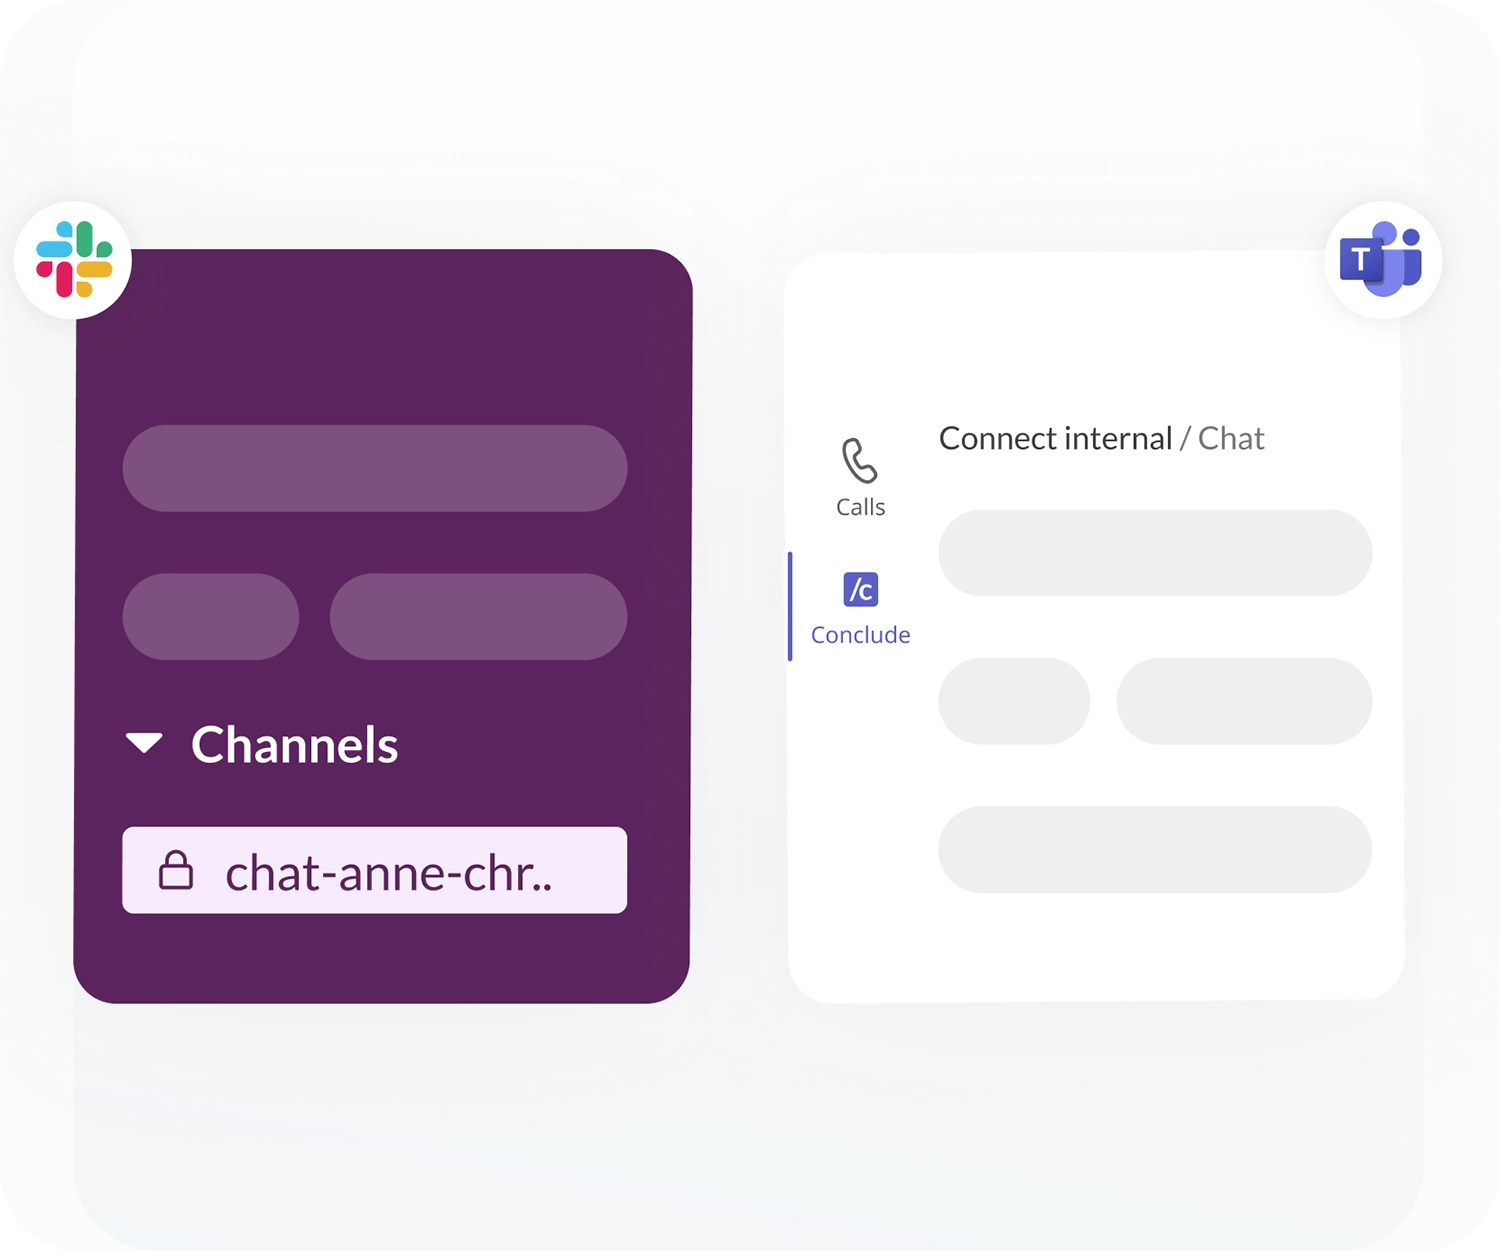
For Conclude Connect, get a clear overview of all your channel connections and chats in one place. Monitor active chats and create new ones.
Customizable metrics and key insights
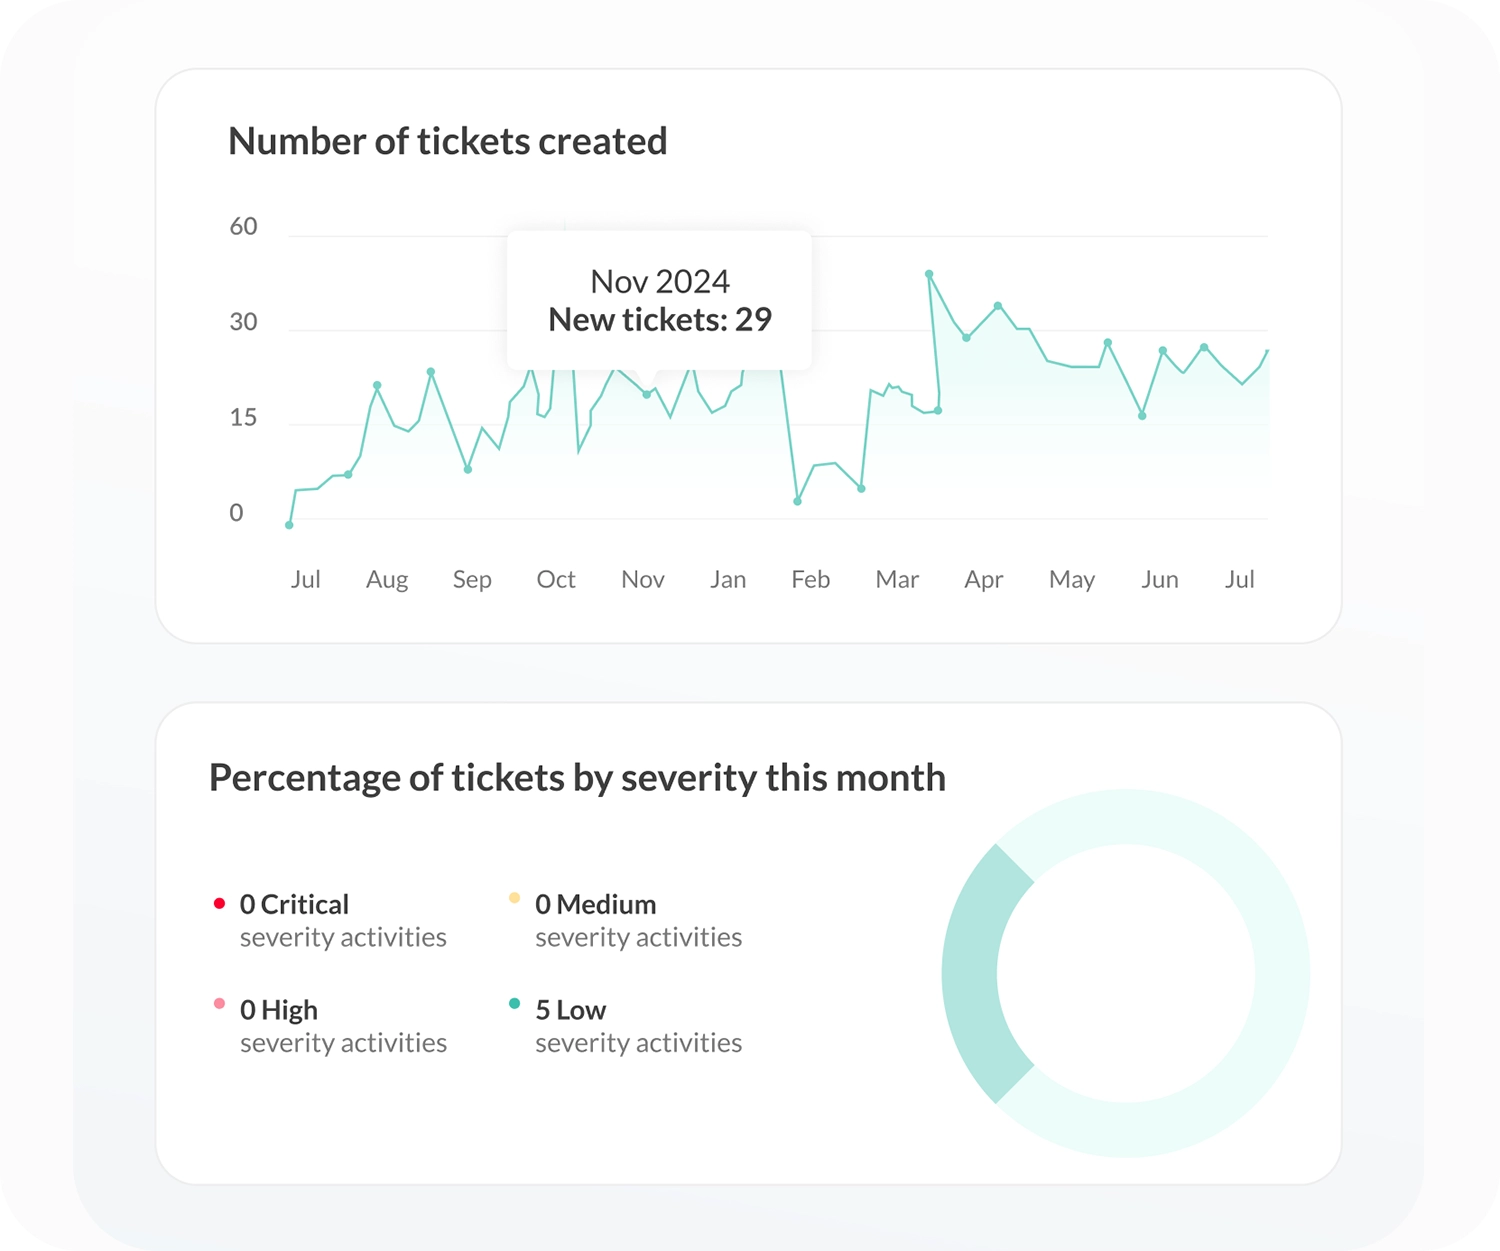
Access your customizable dashboard to monitor metrics from the retired insights tab. Select the metrics or view that’s most relevant to you.
Whether you’re tracking cross-platform channel connections between Slack and Microsoft Teams or reviewing ticket response times, you’ll have a clear, real-time view of everything in your workspace.
Manage Zendesk, Jira and AI integrations
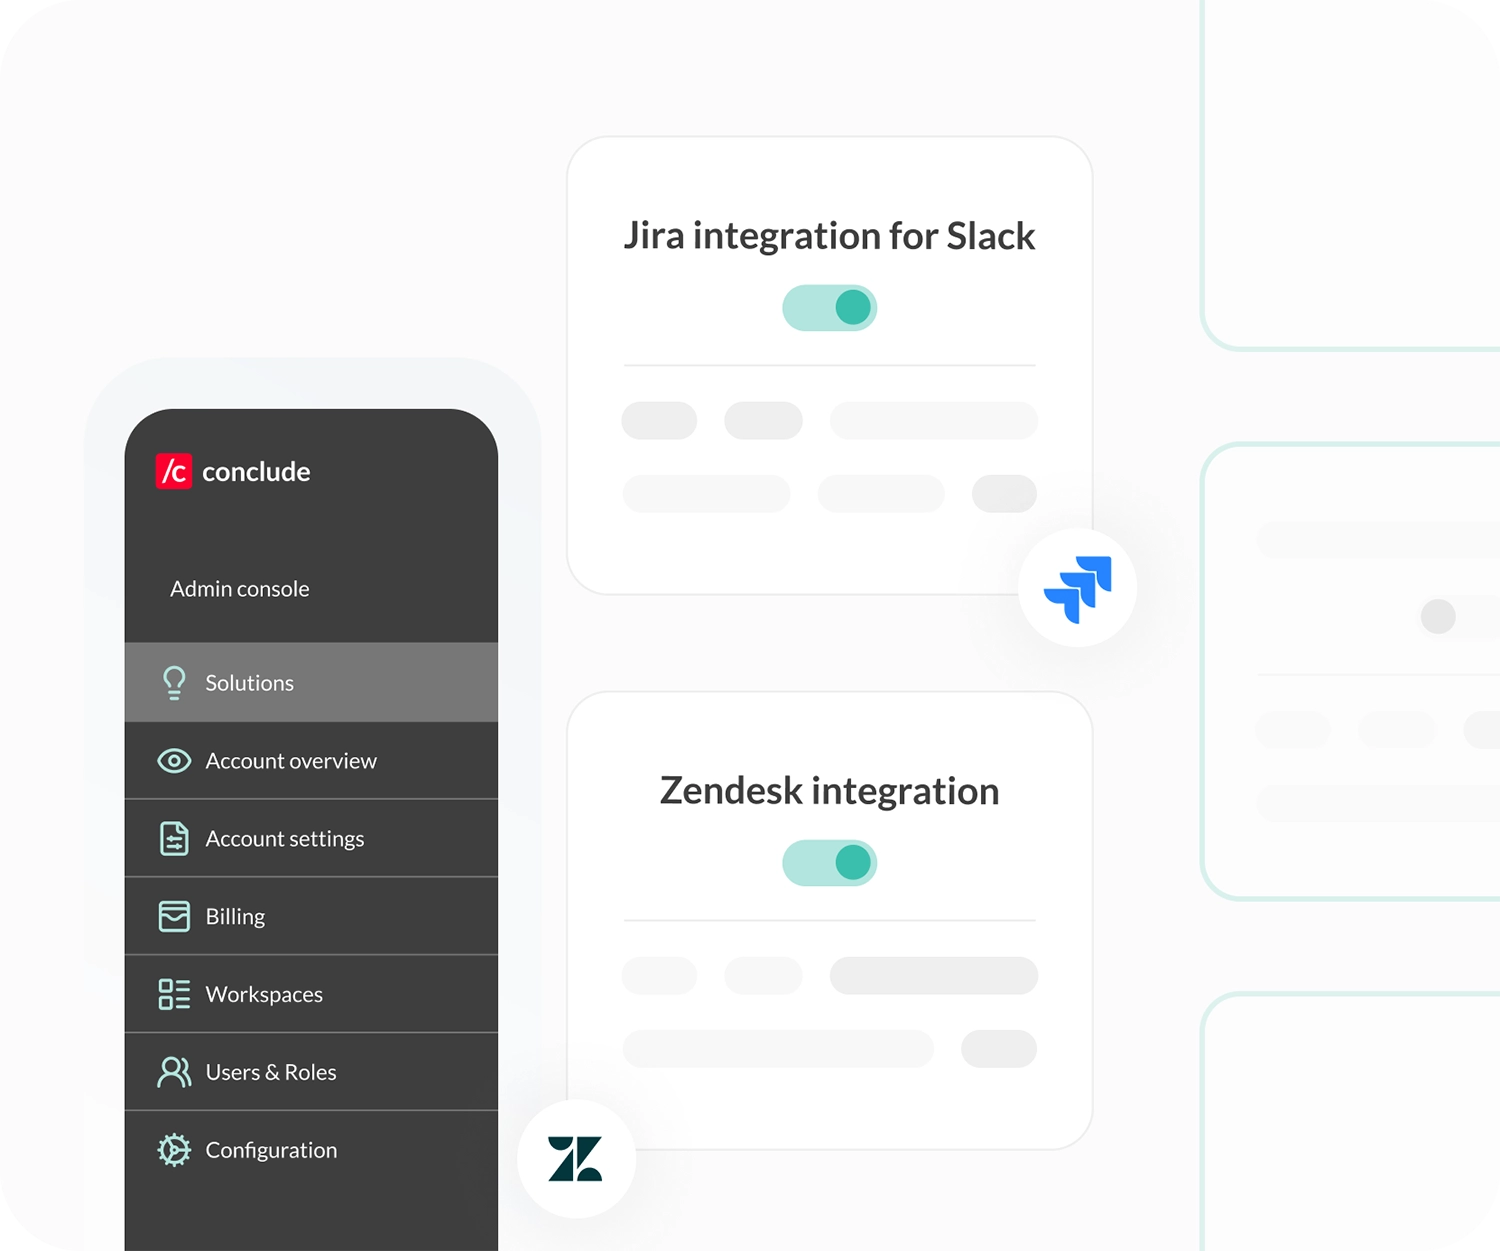
The Admin console is designed to be flexible and easily configurable. Enable solutions, manage workspaces, users, roles, and view active users at a glance.
Set up integrations with Zendesk and Jira, or manage AI-powered language translation for incoming emails. Billing and subscription management are also here, so everything stays organized.
Configure file sharing and message appearance
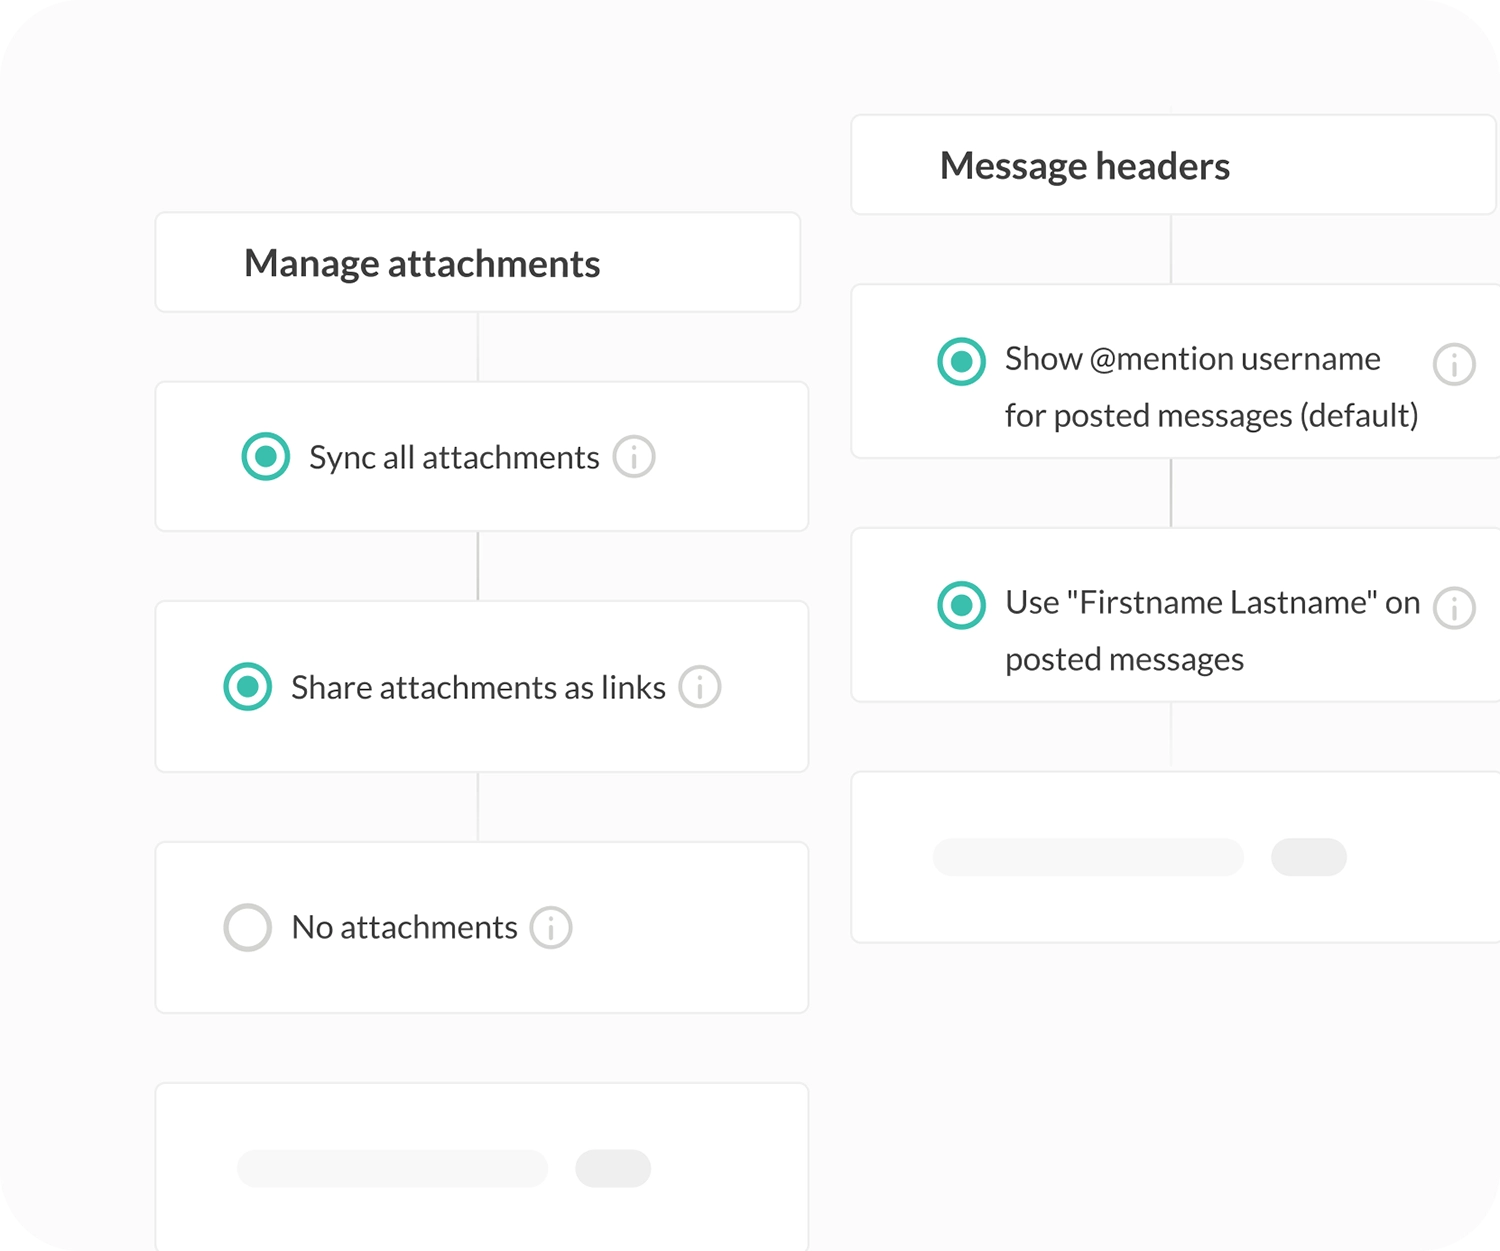
Decide how user identities are shown in message headers, choose between file syncing or link sharing, and decide whether to include or exclude images and attachments.
Define how you sync cross-platform chats
Choose how much conversation history is shared when connecting Slack and Teams channels or chats. Choose to sync full threads, share only the first message with new replies, or disable reply syncing entirely.
These flexible admin settings help teams share the right context while maintaining privacy.
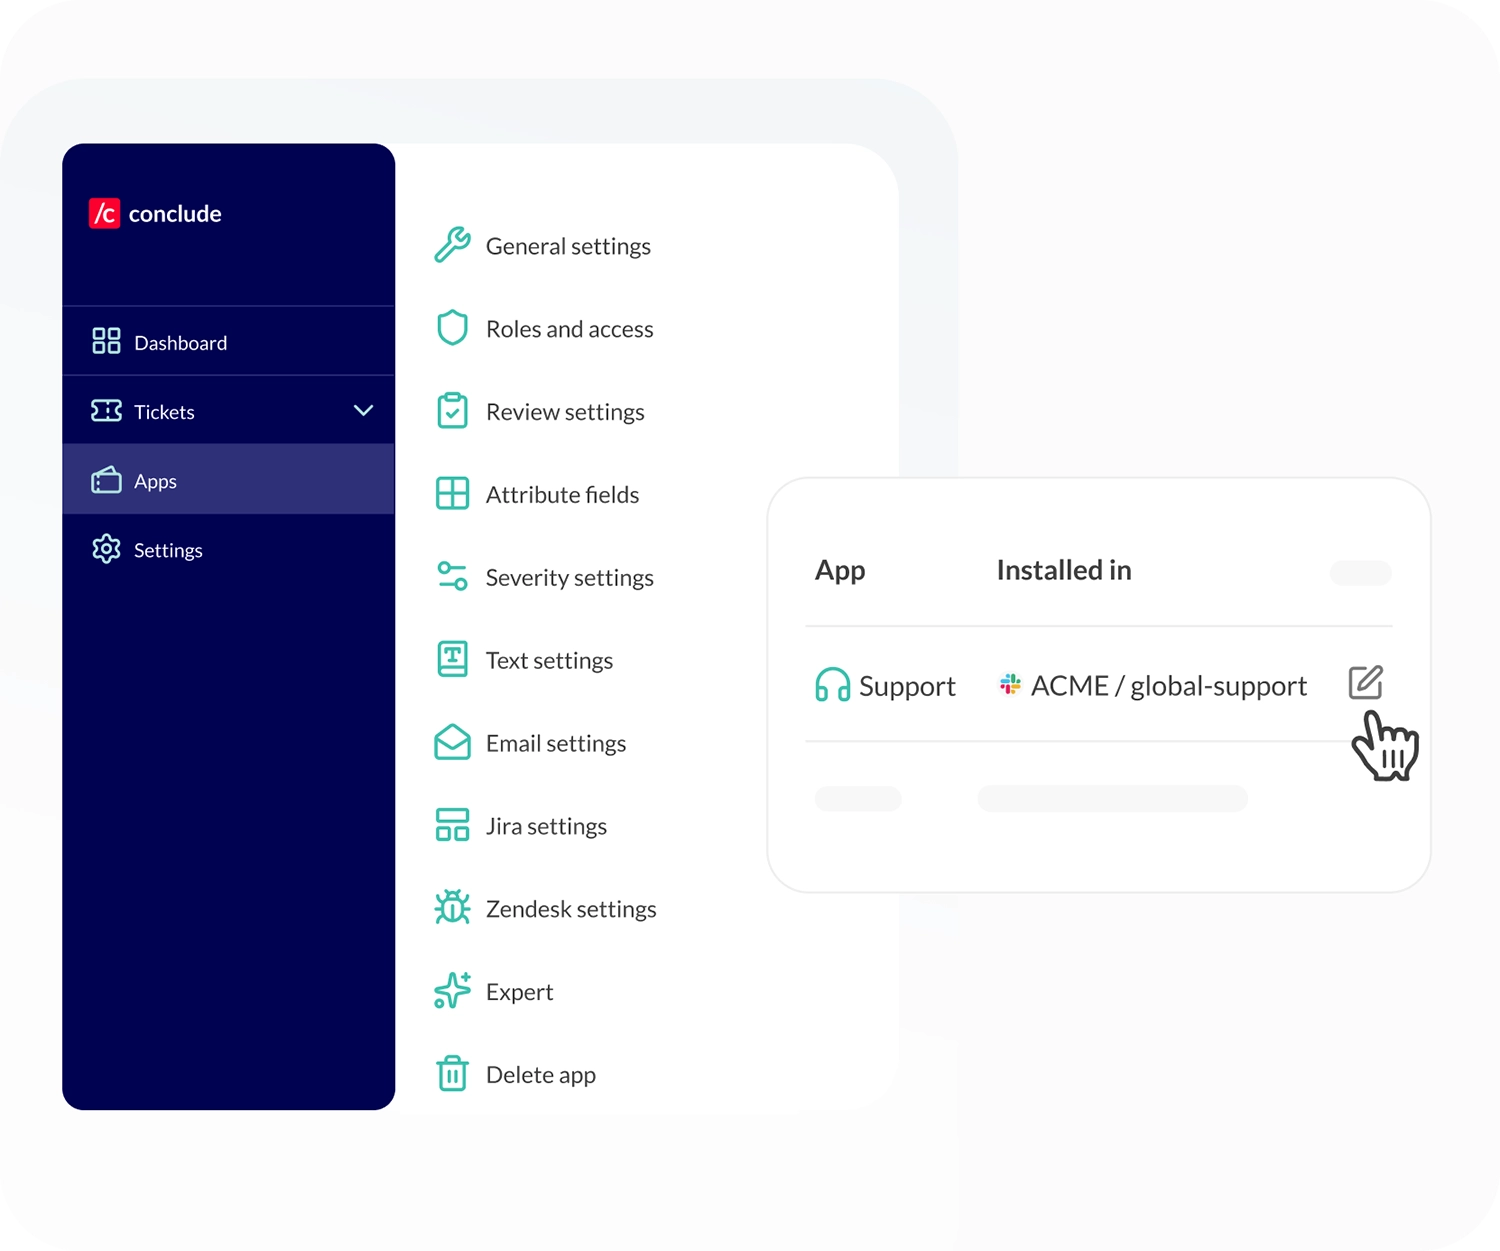
Flexible settings for Conclude Apps
Each Conclude app can be customized under App settings from the Dashboard. Update app details, roles, and review rules, or customize fields, severity levels, and translations.
You can also enable email ticket creation, connect Jira projects, or apply YAML edits for advanced configuration. This flexibility ensures every app fits your team’s workflow.